Income Growth Story Over Time
Download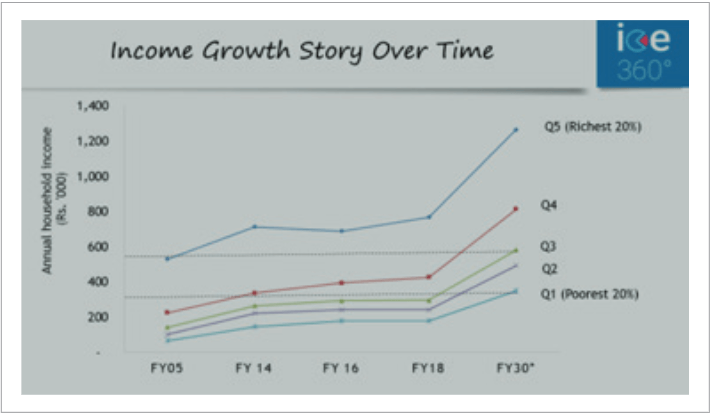
Methodology
- The table on the left is based on NCAER data of 2004-05, the last time their survey was conducted and ICE360 data from then on.
- This is measured income, the measurement methodologies are comparable over time.
- 2020-2030 data was projected from 2016 data and thin sample 2018 data assuming a GDP growth rate of 7.5% per annum
Insights from this data include
- The so called middle class of India is actually India’s upper class which is a discontinuously high earner, spender and saver than the rest.
- There is a 60% mass market fairly close together (quintiles 2,3,4 or the second third and fourth richest 20% slabs of households based on income).
- How stunning the growth story is – in just 15 years, the poorest 20% of India’s households have surpassed the income of the second richest 20% in 2004-05 and in the next 12 years, the poorest 20% will have the same income as the second richest 20% did in 2018.
- Projecting the 2005-2018 trend to 2018 to 2030, we see that the discontinuous earning and spending of the richest 20% continues while the next 20% breaks away from the mass market.