Rural Urban Income Continuum
Download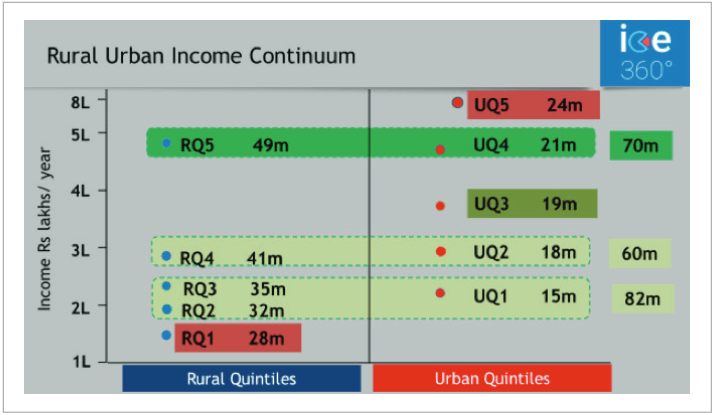
Methodology
- The table on the left shows the different income levels in Rural India and Urban India.
- Households in Rural India are arranged in order of income and divided into 20% slabs representing equal numbers of households. These are Rural income quintiles which are labelled RQ in the table, RQ5 being the richest 20% within rural India and RQ1 being the poorest 20% within rural India. The same has been done for Urban India, labelled UQ or Urban income quintiles. UQ5 is the richest 20% of within urban India and UQ1 the poorest 20%.
Insights from this data include
- The arrival of mass markets spanning urban and rural households with similar income, otherwise similar in aspiration and exposure thanks to the digital and television connected world we live in.
- 24 million household size urban standalone urban rich market.
- A mass-affluent market of about 70 million households spanning the top quintile of rural India and the second richest quintile of urban India.
- Another mass market at the lower end of 60-80 million depending on the product or service.
- A lower income market of 82 million.
While it is known that rural India contributes consumption over 55% of household consumption this points to mass markets that straddle both, urban and rural India.