• Home
  • Who We Are
    • Overview
    • About Price
    • Our Mission
    • Our Goals
    • Our Values
    • Our Motivations
  • What We Do
    • Overview
    • Why People’s Research
    • Activities of PRICE
  • Insights
  • ICE360
    • Overview
    • Survey Methodology
    • Current – 2021 Survey
  • Survey Methodology
  • 2016 Survey
  • Current – 2021 Survey
  • Technical
  • Our Team
  • Media
    • Price in the News
  • Blog
  • Contact Us
Facebook Twitter Search
ICE 360
  • Home
  • Who We Are
    • Overview
    • About Price
    • Our Mission
    • Our Goals
    • Our Values
    • Our Motivations
  • What We Do
    • Overview
    • Why People's Research
    • Activities of PRICE
  • Insights
  • ICE360
    • Overview
    • Survey Methodology
    • Current - 2021 Survey
  • Survey Methodology
  • 2016 Survey
  • Current - 2021 Survey
  • Technical
  • Our Team
  • Media
    • Price in the News
  • Blog
  • Contact Us

Affluence by Geography

Download

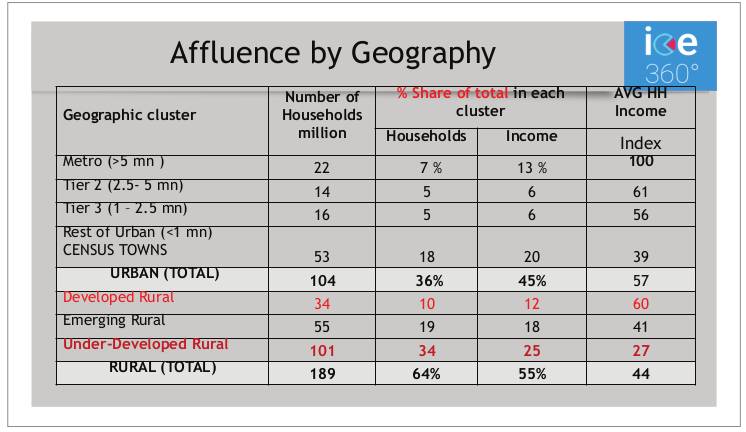
What we know is that Sales in Tier 2 cities are growing and Rural sales are growing. What household level data can tell us is the share of India’s household income in Tier 2 cities resident and in rural India.
Affluence by Geography
Methodology

  • The table on the left shows the number of households in each geographic cluster, and the income that they have as a metric of share of households and share of income. The last two columns are an index of income and expenditure with metros being the highest earners and spenders.
  • In all ICE360 data rural India has been divided at the district level into developed, emerging and underdeveloped rural based on 26 indicators from rural census data. The same state can have different parts of its rural in different development categories.
  • The green rows are geographies that punch above their population weight in income and expenditure and the red ones are where they punch below their population weight (i.e. share of households is greater than / less than share of income / expenditure.

Insights from this data include

  1. A sizeable developed rural segment of 34 million households spanning a few states and with income levels the same as tier 2 towns.
  2. Tier 2 towns punch above their weight on non-routine expenditure rather than on routine expenditure.
  3. The long tail of consumption is visible here with even underdeveloped rural accounting for one third of all households, punching below their population weight, contributing 27% to income/expenditure.


  • Who We Are
  • What We Do
  • Insights
  • Survey Methodology
  • Technical
  • Media
  • Blog
  • Contact Us
Copyrights @2021 | Designed & Developed by Rage Communications Pvt.Ltd.
Facebook Twitter Search
Generic selectors
Exact matches only
Search in title
Search in content
Search in posts
Search in pages
Add to Cart