Class and Mass Sizes
Download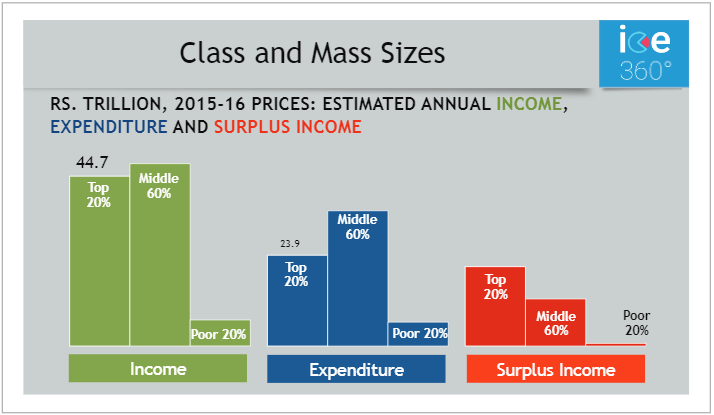
Methodology
- The table on the left shows the combined income, expenditure and surplus income of the richest 20% of households (the so called middle class but we have called it the ‘class’ market) and of the ‘mass market’, the 60% households in the middle of the income ladder which we saw in the earlier table are very close together in income, and the poorest 20%.
Insights from this data include
- The larger size of the mass market pooled together than the class market on income and expenditure.
- The fact that surplus income is much greater with rich households. The bottom 40% of households are either dis-savers or live hand-to-mouth.
- It is only in the top 60% that we begin to see any surplus income details of which are given on the table to the right.