• Home
  • Who We Are
    • Overview
    • About Price
    • Our Mission
    • Our Goals
    • Our Values
    • Our Motivations
  • What We Do
    • Overview
    • Why People’s Research
    • Activities of PRICE
  • Insights
  • ICE360
    • Overview
    • Survey Methodology
    • Current – 2021 Survey
  • Survey Methodology
  • 2016 Survey
  • Current – 2021 Survey
  • Technical
  • Our Team
  • Media
    • Price in the News
  • Blog
  • Contact Us
Facebook Twitter Search
ICE 360
  • Home
  • Who We Are
    • Overview
    • About Price
    • Our Mission
    • Our Goals
    • Our Values
    • Our Motivations
  • What We Do
    • Overview
    • Why People's Research
    • Activities of PRICE
  • Insights
  • ICE360
    • Overview
    • Survey Methodology
    • Current - 2021 Survey
  • Survey Methodology
  • 2016 Survey
  • Current - 2021 Survey
  • Technical
  • Our Team
  • Media
    • Price in the News
  • Blog
  • Contact Us

Risk Map: Occupation X Income Group X Consumption Weight

Download

Income x Expenditure x Occupation x Savings/ Investments x Living Conditions x Access to infrastructure and welfare data are all collected from the same household enabling cross analysis and more meaningful insights.

INTEGRATED ANALYSIS & INSIGHTS: Occupation and Consumption
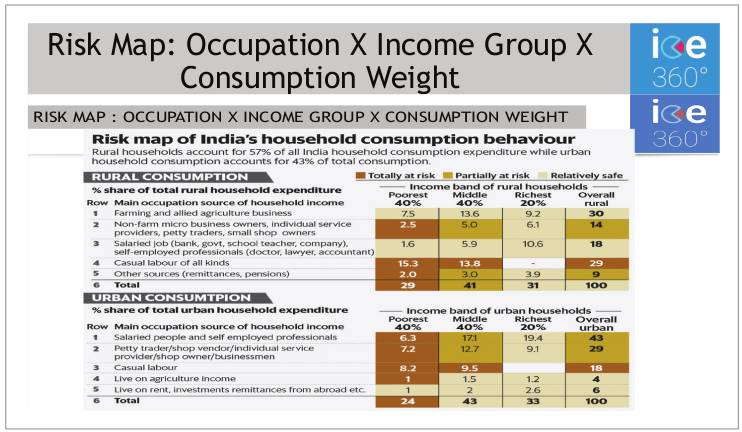
Risk Map: Occupation X Income Group X Consumption Weight
Methodology

  • The table on the left shows, separately for rural India and for urban India, the occupations that households are mainly dependent on and the income distribution that each occupation group has; it then shows the contribution to rural/urban total household consumption expenditure of each occupation x income group.
  • So, 7.5 in the topmost left-hand corner means that 7.5% of rural consumption expenditure comes from farmers in the lowest income group.

Insights from this data include

  1. Includes identifying consumption at risk due to environmental factors that may affect some occupations more than others.

Detailed insights are available at
https://www.livemint.com/news/india/only-half-of-india-s-household-consumption-will-come-through-post-covid-11587321841699.html


  • Who We Are
  • What We Do
  • Insights
  • Survey Methodology
  • Technical
  • Media
  • Blog
  • Contact Us
Copyrights @2021 | Designed & Developed by Rage Communications Pvt.Ltd.
Facebook Twitter Search
Generic selectors
Exact matches only
Search in title
Search in content
Search in posts
Search in pages
Add to Cart