• Home
  • Who We Are
    • Overview
    • About Price
    • Our Mission
    • Our Goals
    • Our Values
    • Our Motivations
  • What We Do
    • Overview
    • Why People’s Research
    • Activities of PRICE
  • Insights
  • ICE360
    • Overview
    • Survey Methodology
    • Current – 2021 Survey
  • Survey Methodology
  • 2016 Survey
  • Current – 2021 Survey
  • Technical
  • Our Team
  • Media
    • Price in the News
  • Blog
  • Contact Us
Facebook Twitter Search
ICE 360
  • Home
  • Who We Are
    • Overview
    • About Price
    • Our Mission
    • Our Goals
    • Our Values
    • Our Motivations
  • What We Do
    • Overview
    • Why People's Research
    • Activities of PRICE
  • Insights
  • ICE360
    • Overview
    • Survey Methodology
    • Current - 2021 Survey
  • Survey Methodology
  • 2016 Survey
  • Current - 2021 Survey
  • Technical
  • Our Team
  • Media
    • Price in the News
  • Blog
  • Contact Us
View cart “Income Structure of Consumer India” has been added to your cart.

Income Structure of Consumer India

Download

Macro-Consumer Insight and Citizen Centred Policy is the Focus of All The Data That We CollectFROM HOUSEHOLD INCOME DATA

Income structure of Consumer India
Methodology

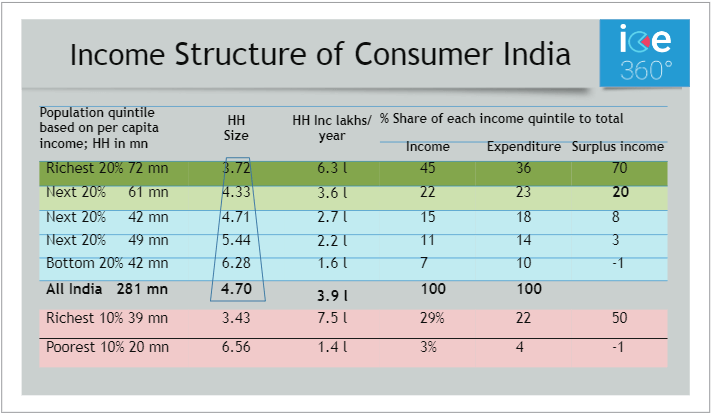
  • The table on the left is based on ICE 360° survey as measured in 2016.
  • Households are arranged in order of measured per capital income and divided into income slabs of equal population size, ranging from the richest 10% number of households to the poorest 10% number of households.
  • The percentage of Indian household income sitting in each pool is measured, and that percentage is then applied to the total disposable income number put out by the Government (CSO) and “adjusted income” per household is derived.
  • Surplus income is the income left after all expenses has been met.

Insights from this data include

  1. Decreasing family size with income increase (giving premium consumption a boost).
  2. Precise share of mass and class market potential.
  3. Indian households are not as rich as we think they are nor as poor as we think they are.
  4. Given the skewed distribution of income surplus, demand for premium products and discretionary goods is less prone to most economic shocks.


  • Who We Are
  • What We Do
  • Insights
  • Survey Methodology
  • Technical
  • Media
  • Blog
  • Contact Us
Copyrights @2021 | Designed & Developed by Rage Communications Pvt.Ltd.
Facebook Twitter Search
Generic selectors
Exact matches only
Search in title
Search in content
Search in posts
Search in pages
Add to Cart