• Home
  • Who We Are
    • Overview
    • About Price
    • Our Mission
    • Our Goals
    • Our Values
    • Our Motivations
  • What We Do
    • Overview
    • Why People’s Research
    • Activities of PRICE
  • Insights
  • ICE360
    • Overview
    • Survey Methodology
    • Current – 2021 Survey
  • Survey Methodology
  • 2016 Survey
  • Current – 2021 Survey
  • Technical
  • Our Team
  • Media
    • Price in the News
  • Blog
  • Contact Us
Facebook Twitter Search
ICE 360
  • Home
  • Who We Are
    • Overview
    • About Price
    • Our Mission
    • Our Goals
    • Our Values
    • Our Motivations
  • What We Do
    • Overview
    • Why People's Research
    • Activities of PRICE
  • Insights
  • ICE360
    • Overview
    • Survey Methodology
    • Current - 2021 Survey
  • Survey Methodology
  • 2016 Survey
  • Current - 2021 Survey
  • Technical
  • Our Team
  • Media
    • Price in the News
  • Blog
  • Contact Us
View cart “Firewood usage by district development clusters (rural)” has been added to your cart.

Firewood usage by district development clusters (rural)

Download

For urban households’ LPG is the major source of cooking fuel (79%) while for rural households, it is firewood (57%). At an all-India level, the split between gas and firewood is 47% vs 42%.

A majority (66%) of the least developed district cluster households (D1) still use firewood while an overwhelming 92% households in the most developed districts use piped gas/LPG.

Type of cooking fuel by location

(Per cent of households)
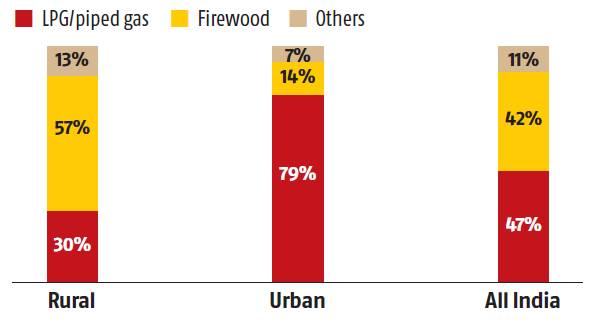
The lower the development, the higher the use of firewood

Type of cooking fuel by DDCs*

(Per cent of households)
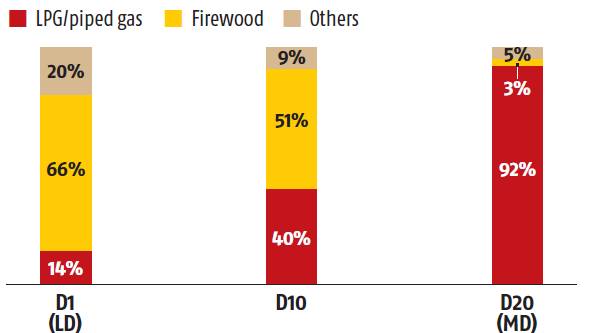
The lower the development, the higher the use of firewood

LD: Least Developed District Cluster MD: Most Developed District Cluster

*District Development Cluster

Source: ICE 3600 Survey (2016)


  • Who We Are
  • What We Do
  • Insights
  • Survey Methodology
  • Technical
  • Media
  • Blog
  • Contact Us
Copyrights @2021 | Designed & Developed by Rage Communications Pvt.Ltd.
Facebook Twitter Search
Generic selectors
Exact matches only
Search in title
Search in content
Search in posts
Search in pages
Add to Cart